Generate the Data for Analysis
# DGP
set.seed(66)
# Z is a binary variable in this case, but it can also be continuous.
df <- data.frame(Z = c(rep(0, 100), rep(1, 100)),
                 W = rnorm(200)) %>%
  # Z affects X
  mutate(X = .5 + 2*W + 2*Z + rnorm(200)) %>%
  # Z does NOT affect either Y or W (God's Game)
  mutate(Y = -X + 4*W + 1 + rnorm(200)) %>%
  group_by(Z) %>%
  mutate(mean_X=mean(X), mean_Y=mean(Y)) %>%
  ungroup()
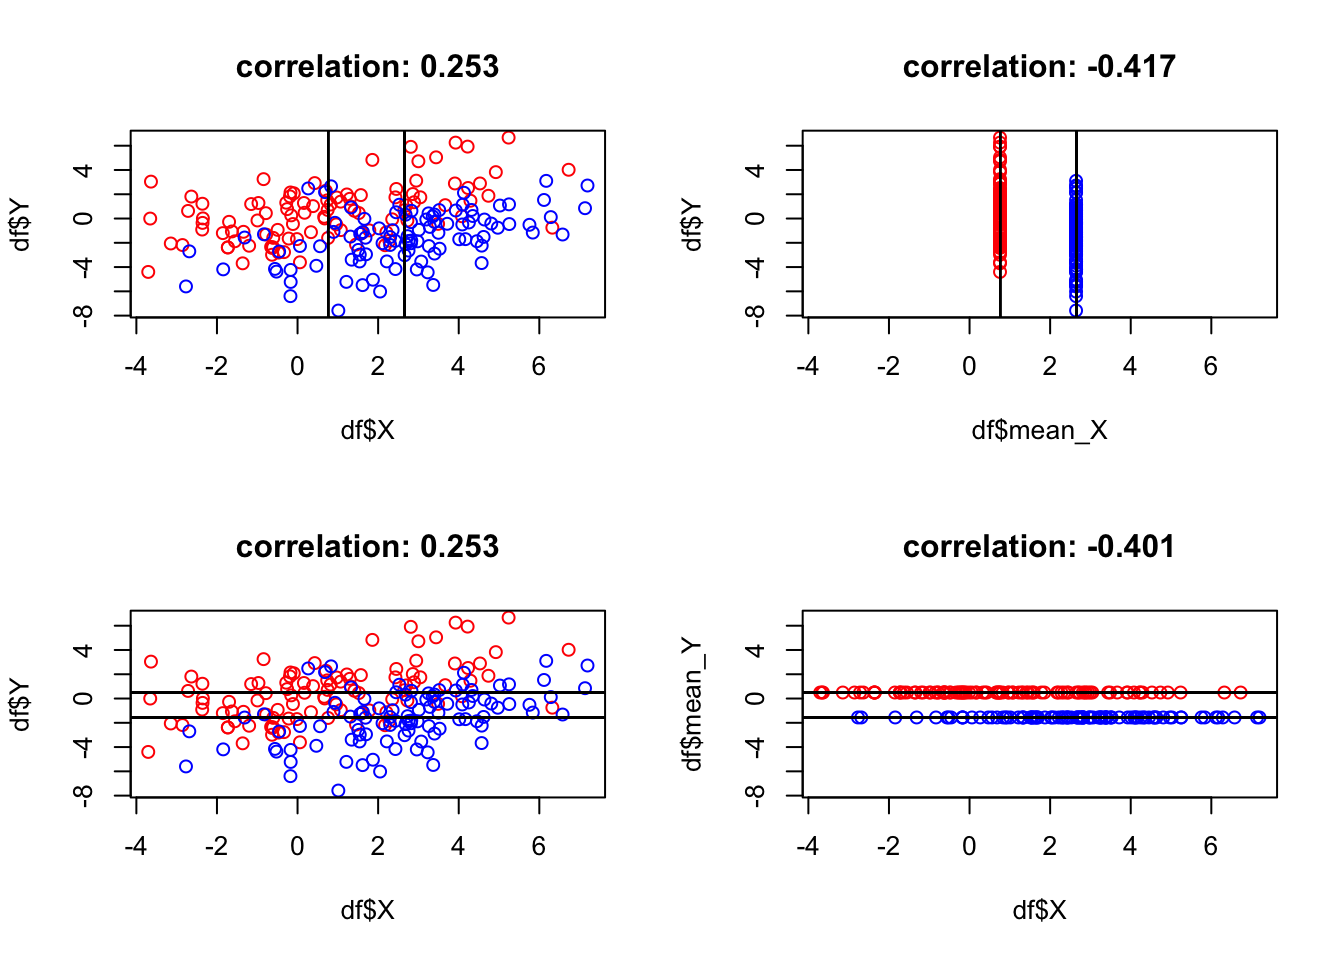
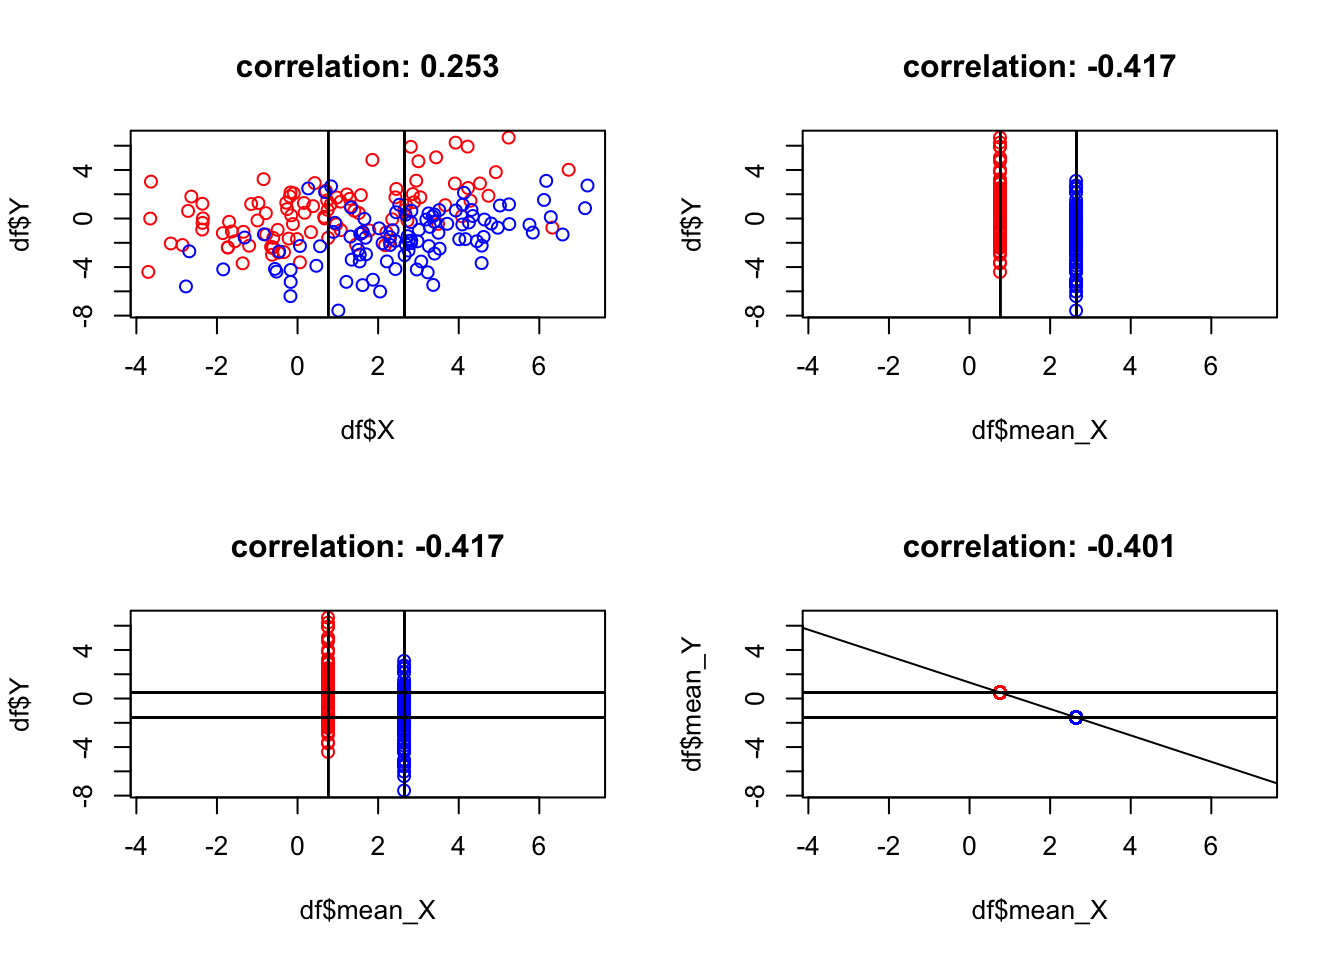
Run the Regression and Check the Estimate of X
library(AER)
# Z is the instrument variable
summary(ivreg(Y ~ X | Z , data = df)) %>%
  coef() %>%
  regrrr::to_long_tab()
##   n.r        var_      beta
## 1   1 (Intercept)    1.318*
## 2   1               (0.583)
## 3   2           X -1.089***
## 4   2               (0.300)