1 Motivation
On a whim, I mapped out what people say (the text) and feel (the sentiment) about the top tech companies (FAAMG) on twitter since the Covid-19 outbreak. The keywords and sentiment that are associated with the main topics should differ across these companies.
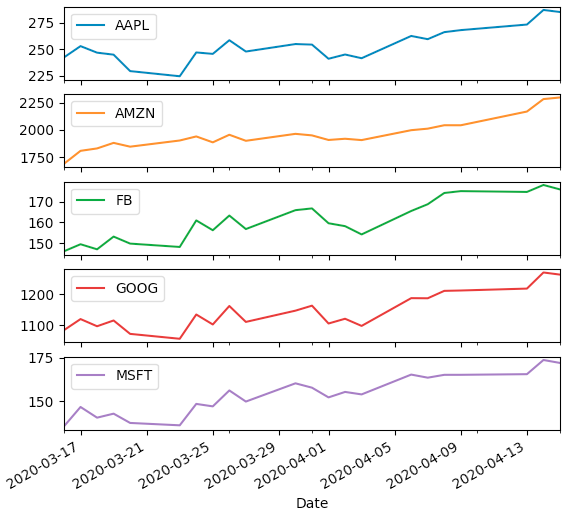
By no means I am drawing any causal association here. But the story starts with checking the recent price movements of the FAAMG stocks. Obviously, Covid-19 has impacted these companies quite differently.
2 Procedures
2.1 Data Source
For each company, I downloaded 1,000 tweets containing the company name as the hashtag (e.g. “#amazon” for Amazon). I used Python module “tweepy” to stream the data and set the “since” parameter to ‘2020-03-01’, which collects a sample of 1,000 tweets since March 1st.
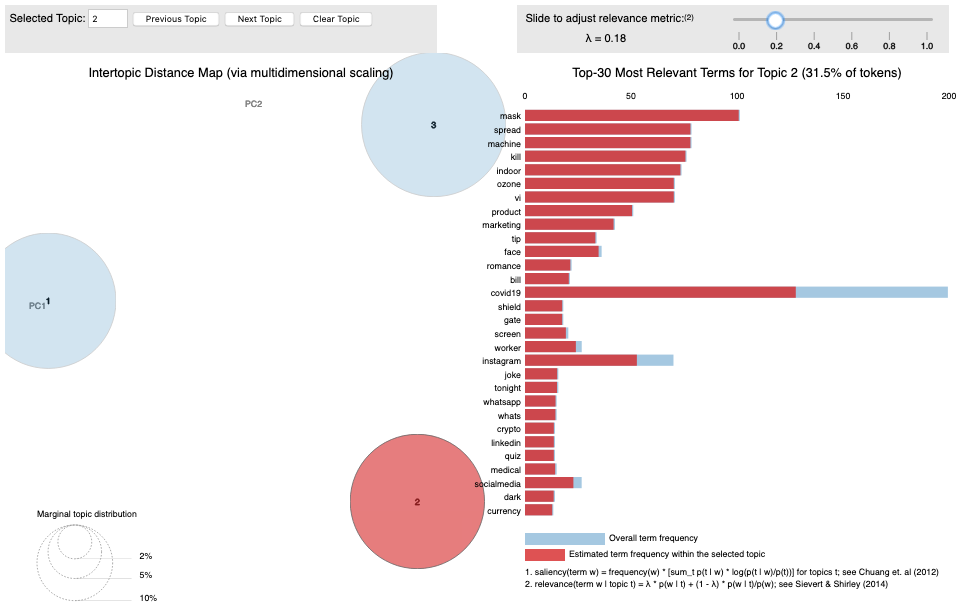
2.2 Topic Modeling
Using Python module “gensim”, I detected three most significant topics (including Covid-19, business, and daily life), which are named by the associated keywords (most relevant terms).
Using Python module “vaderSentiment”, I computed sentiment scores for each tweet and aggregated the scores by company. The topic-based sentiment scores are used to construct the perceptual map, in which each company takes a different position. Using Python module “nltk”, I find the most frequent topic-based co-occurring words for each company.
3 Results
3.1 Perceptual Map of FAAMG Based on Topic Sentiment
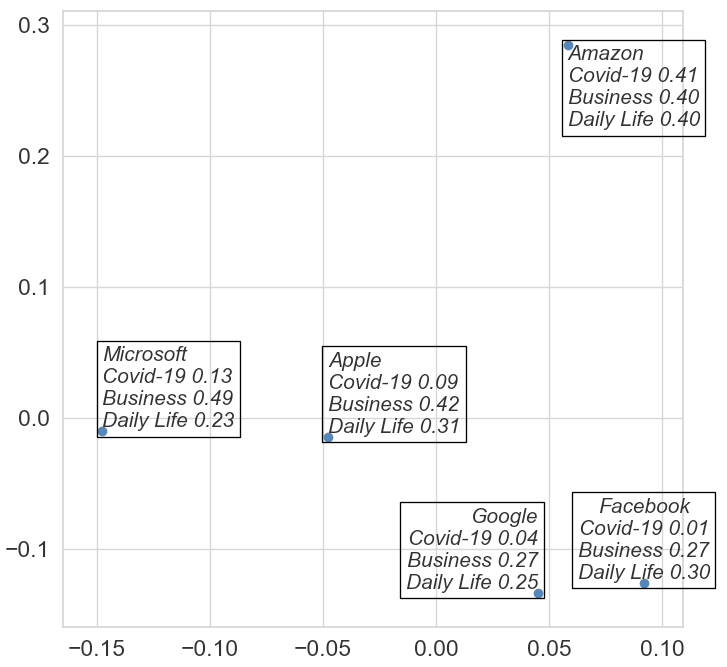
It looks Amazon does well on all topics, especially on Covid-19-related topic. Microsoft and Apple do well on “Business”.
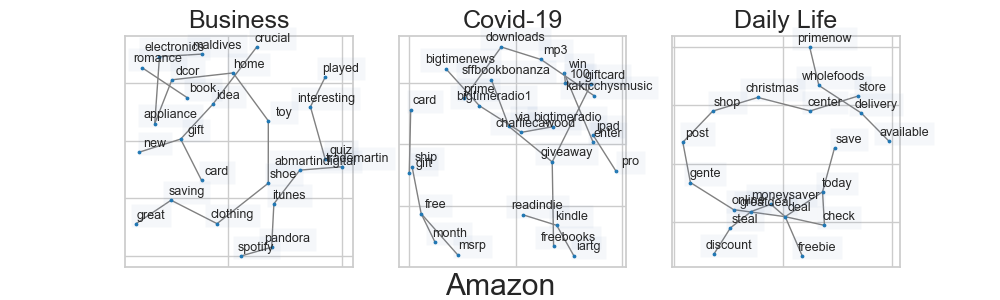
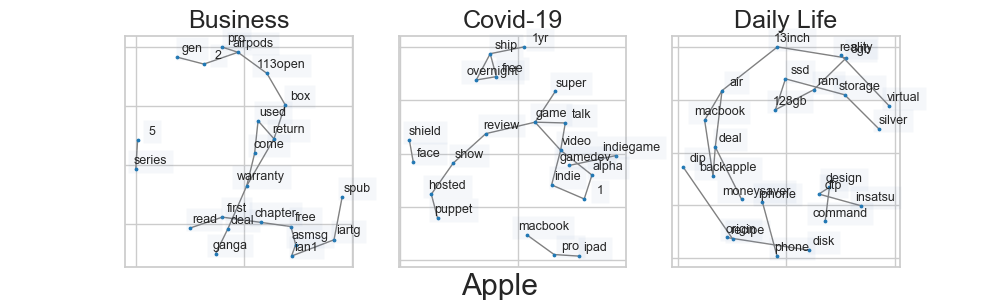
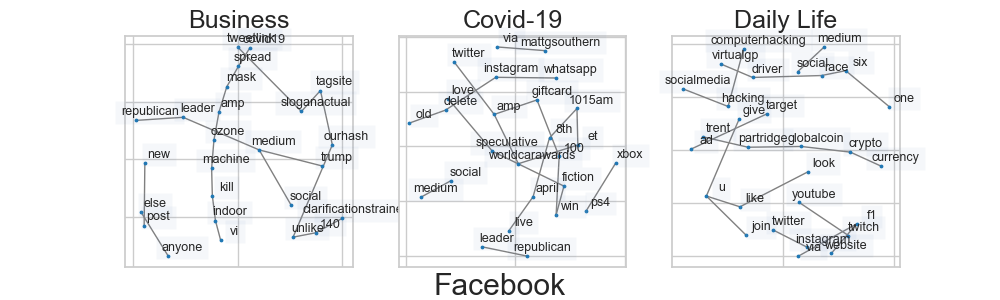
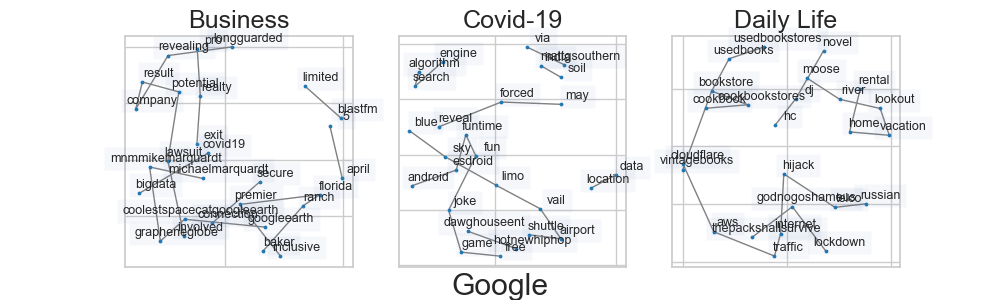
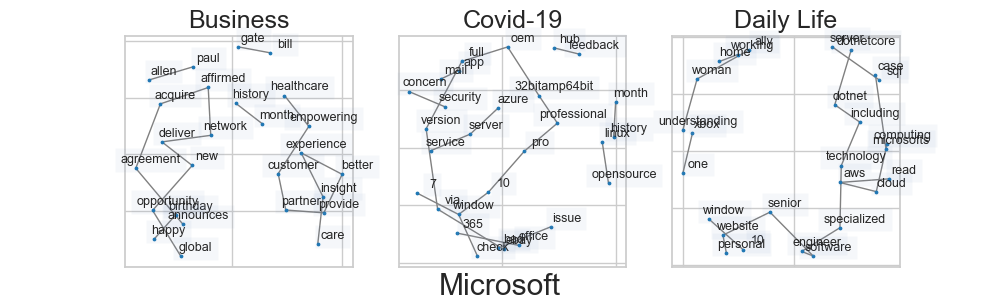
3.2 Keywords Co-occurrence Network on Each Topic
Here are the work keywords co-occurrence patterns for each topic of these companies.