In this post, I calculated the positioning of big tech firms based on two metrics, the multiple-industry presence (based on 3-digit SIC codes) versus the competition description (in 10-K filings), and compared the difference between the two approaches.
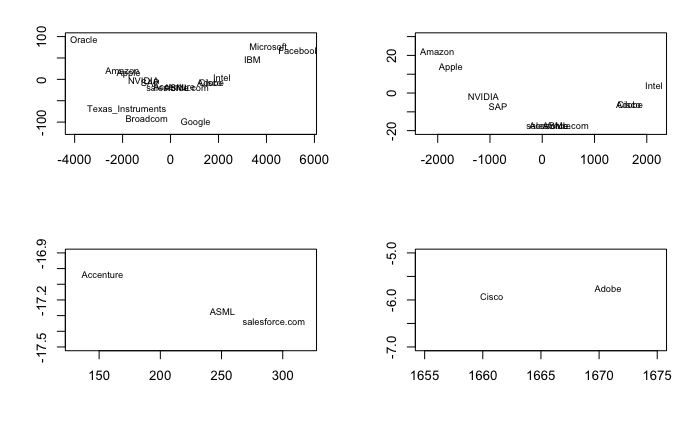
1 the positioning by industry presence across SIC categories
Scholars have used SIC codes to understand interfirm differences 1 Big public firms typically straddle across multiple SIC industry categories. So it is straightforward and easy to see their positionings by multiple-industry participation. Accordingly, a firm’s position can be calculated as the sales distribution across multiple SIC industry categories 2.
2 the positioning by competition description in 10-K filing
The SIC-code might be “backward-looking,” as firms tend to quite if particular combinations of multiple-industry business lines create economic inefficiencies. Only efficient multi-industry presence survives.
In contrast, the SEC filings may reflect managers’ current understanding of what they do. Especially when they characterize their competition, managers tend to draw their forward-looking expectations on the various forms of competitive threats. Some scholars3 and companies4 have used the text-based approach to calculate inter-industry distance.
2.1 calculating positioning based on the competition description
I collected the competition description texts of the largest 17 tech companies. Below are some frequently used words in those statements.

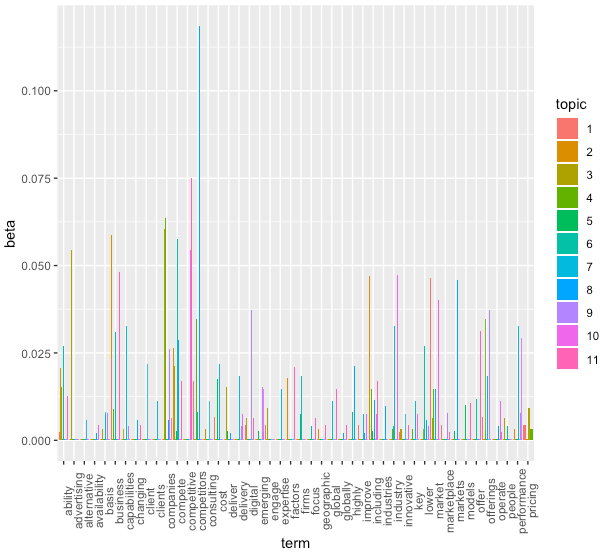
I ran an LDA topic modeling with 11 latent topics, which yields a low perplexity score.

The figure below shows how the 11 topics distribute across terms.
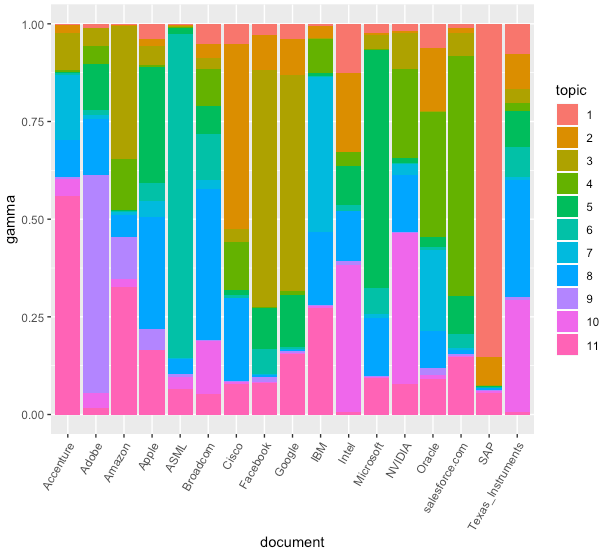
This is the topic loading on the 11 firms’ competition description, which is used to calculate the pairwise distance.
2.2 the final result: positioning by competition description
Here is the positioning map based on the competition description. The graph on the right shows the positioning of American companies. Looking at the results, we can see some interesting differences. The competition description moves some firms closer or further away from one another as compared to the SIC-presence positioning map.
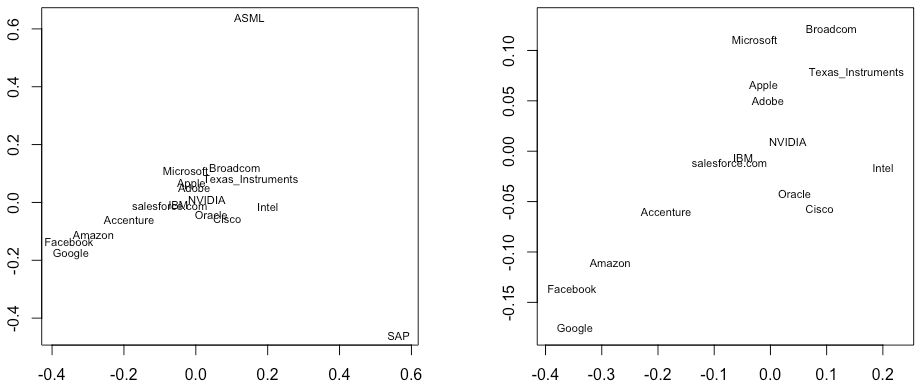
for example:
Teece, D. J., Rumelt, R., Dosi, G., & Winter, S. (1994). Understanding corporate coherence: Theory and evidence. Journal of economic behavior & organization, 23(1), 1-30.
Lien, L. B., & Klein, P. G. (2013). Can the survivor principle survive diversification?. Organization Science, 24(5), 1478-1494.
↩Litov, L. P., Moreton, P., & Zenger, T. R. (2012). Corporate strategy, analyst coverage, and the uniqueness paradox. Management Science, 58(10), 1797-1815.Lien, L. B., & Klein, P. G. (2013).↩