1. Motivation
Due to enduring resource heterogeneity, firms tend to hold persistent positionings within an established industry (like commercial banking). However, transformative corporate actions may alter a firm’s asset structure and create a new industry for the acquirer. Thus, we can map out the industry positions and track the position change caused by an acquisition.
2. Mapping the Positioning and Tracking the Movement
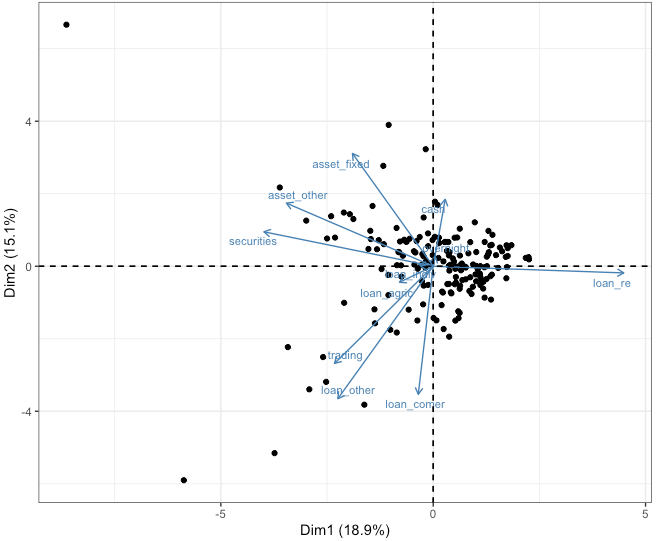
2.1 the Biplot
Consider commercial banks as an example. Different banks may hold differently structured financial asset portfolios and occupy different positions. We can assess a bank’s position based on the proportion of cash, commercial loans, mortgage loans, etc., as a percentage in the total asset (i.e., multiple dimensions). A biplot can provide us a quick intuition about how those dimensions relate to one another. However, the relative positions shown on biplot would not be accurate due to the loss of information in dimension reduction.
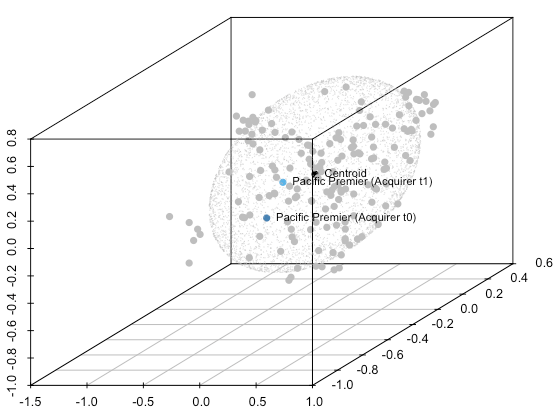
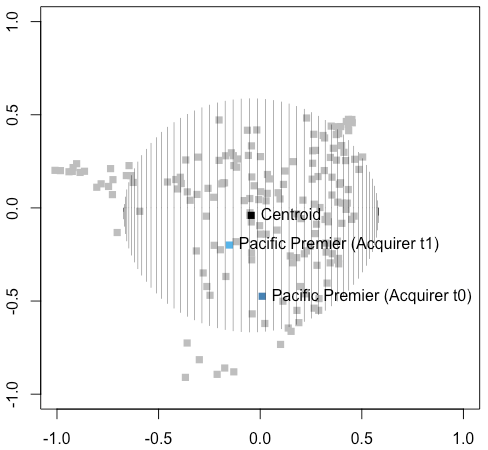
2.2 the 3-D and 2-D Scatterplots based on MDS
In an alternative approach, we can build distance-based features by exploring the inter-firm distance using multi-dimensional scaling (MDS). On Feb. 12th, 2018, Pacific Premier Bancorp launched an acquisition of Grandpoint Capital. Using this acquisition event as an example, we can first calculate the interfirm distance using MDS and then track how the acquisition shifts a bank’s position (in both a 3-D and 2-D scatter plots).